Bond Yields Are Breaking Bad
The recent breakout of the 40-year channel does carry a potential warning regarding yields continuing higher.

Following the Great Financial Crisis (GFC) in 2008, the Fed and other global central banks kept interest rates super low while also performing "bond market stimulus" via Quantitative Easing. This extended the 40-year secular bull market in bonds that started way back in the 1980s. The final exclamation point on that multi-decade move came post-COVID, as rates were pushed to absurd lows (10-year Treasury yield of 0.5%).
The problem with all that stimulus (particularly once the government joined in and added direct fiscal stimulus to the Fed's longstanding monetary measures) is it finally unleashed the inflation genie. That finally broke the magnificent bond bull market, ushering in a huge rise in rates last year, and the nastiest bond bear market in many years (perhaps ever).
Here's a long-term look at that 40-year bond bull market, displayed through the lens of an incredible channel of declining 10-year Treasury yields.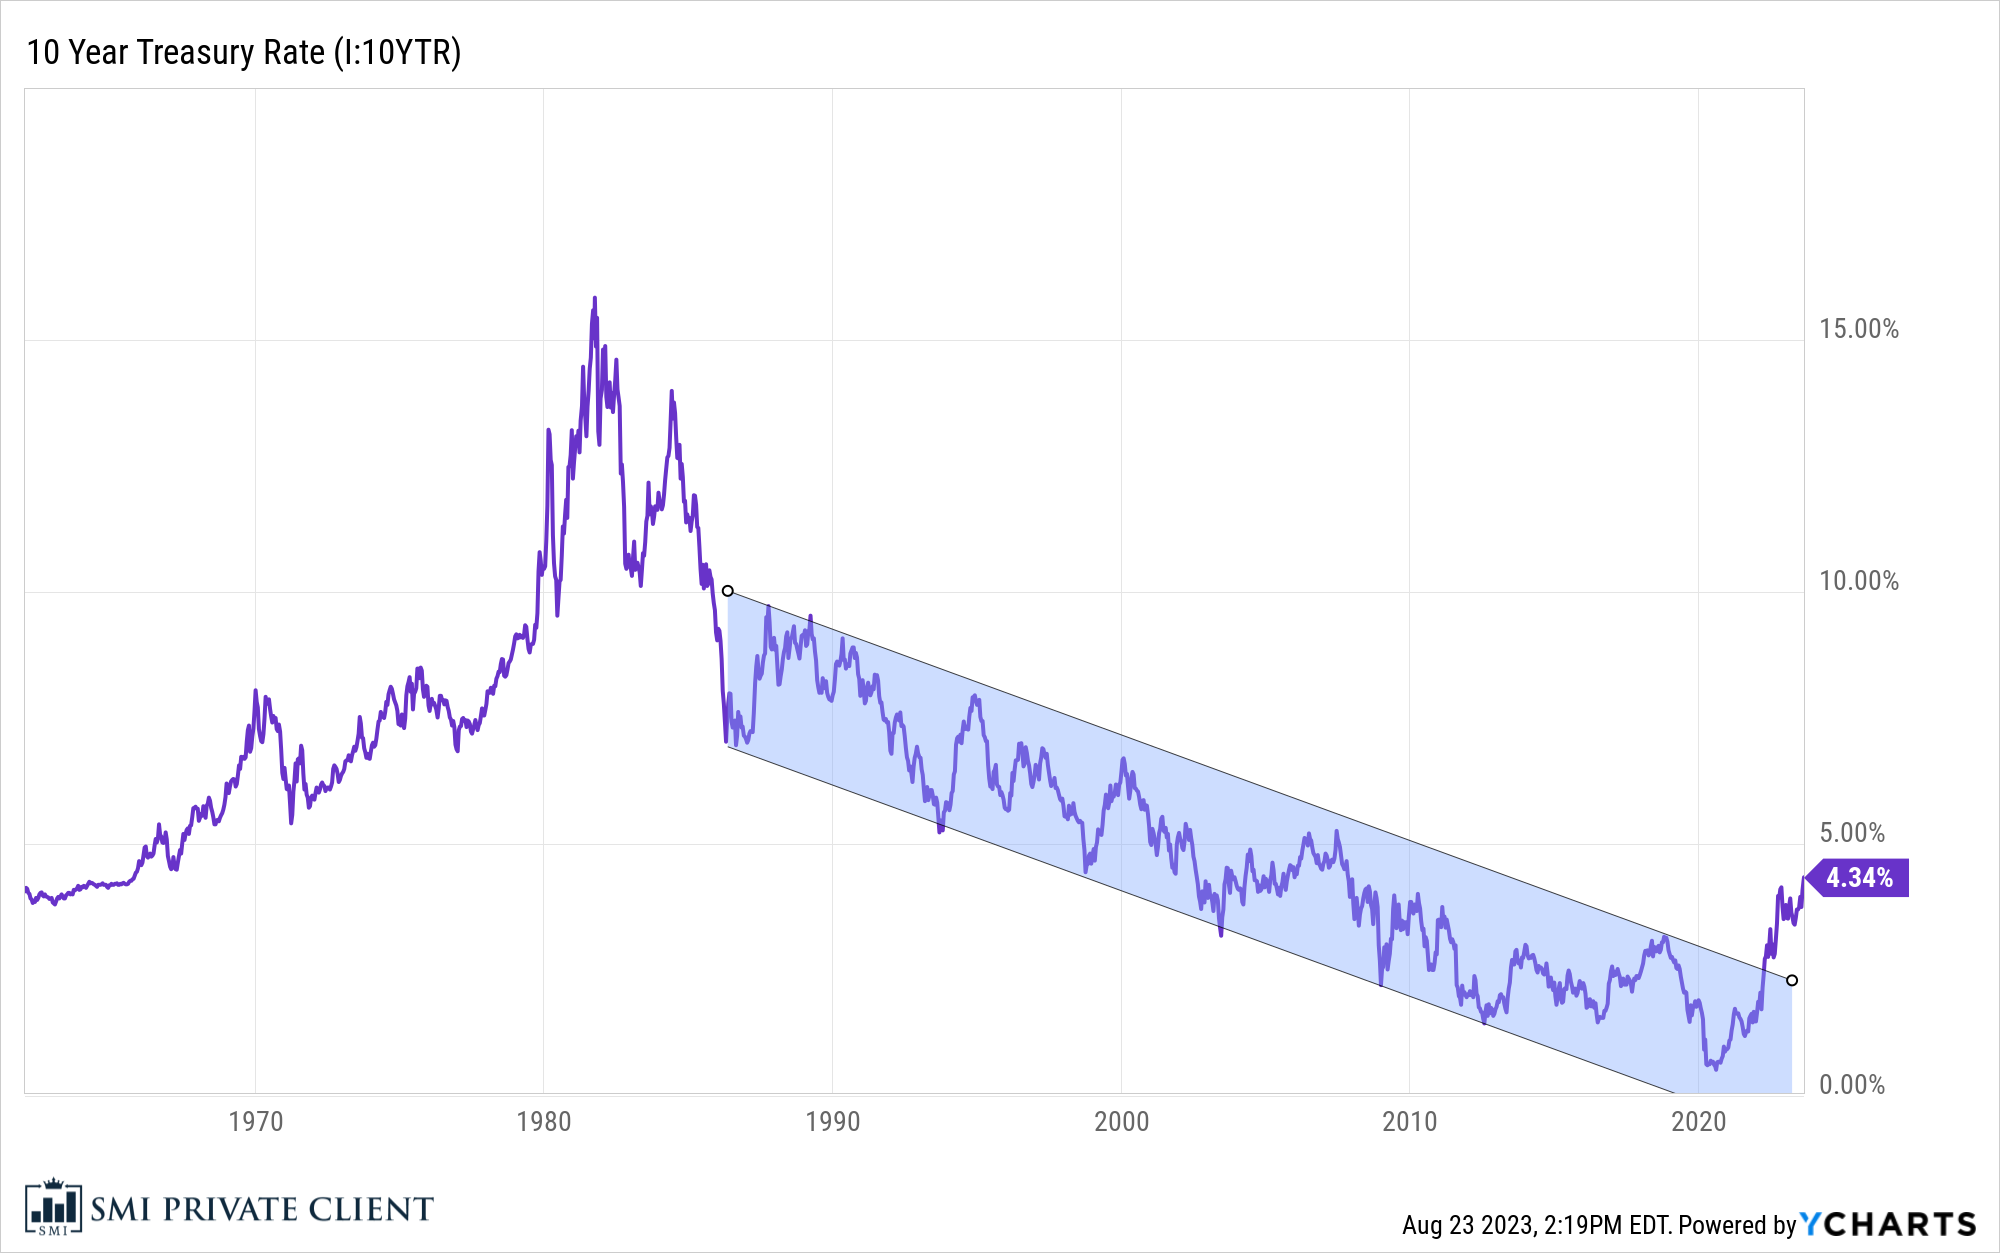
Zooming in, we can see that the recent surge in rates has taken Treasury yields back to their highest levels in 15+ years...to right before the GFC. Ruh roh.
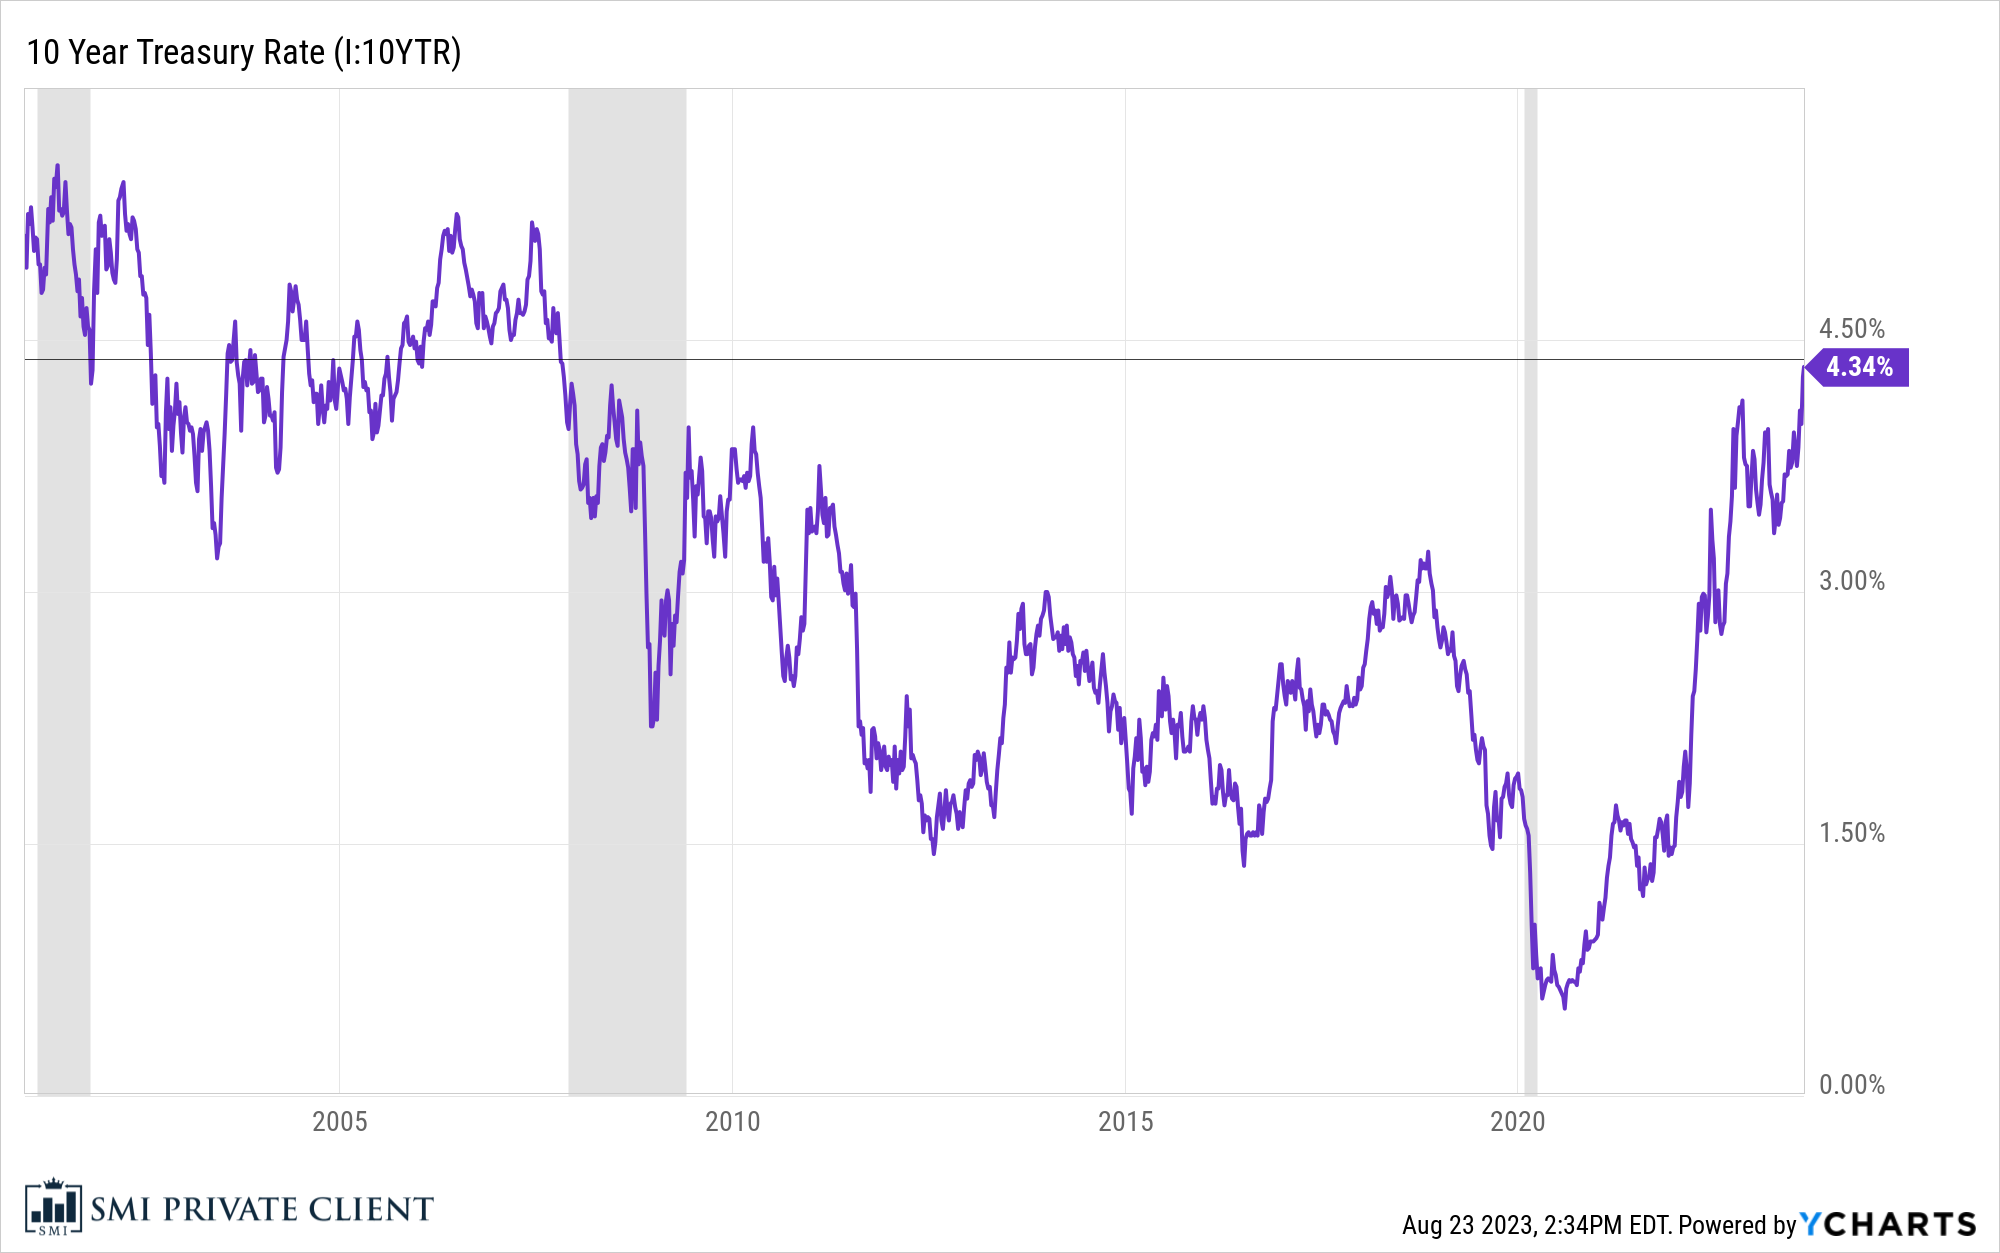
That's definitely not to imply another financial crisis is ahead. But it is to point out that bond yields have, over the past three years, retraced the entirety of their move lower since 2007. And as we often repeat at SMI, bond yields and bond prices move in opposite directions, so in this case, bond yields up = bond prices down.
As data analyst and hedge fund manager Tommy Thornton pointed out recently, another way of framing this is that bond prices have just hit their lowest point since pre-GFC. If the stock market had just returned to its pre-GFC 2007 level, investors would be losing their collective minds. But most investors' eyes glaze over when bonds are discussed, so with the exception of a slightly annoying August pullback in the S&P 500 index, this hasn't gotten a lot of attention. Here's the long-term monthly chart Thornton posted of bond prices, which really shows the magnitude of the bond drop the past few years. Ignore all the extra stuff in the chart and just note the huge run higher in bond prices from 2000-2020, followed by the brutal selloff over the past three years. It's pretty jarring, especially given the reputation for safety that bonds carry. Many bond investors have seen a good chunk of their past 15 years of bond returns wiped out. SMI investors have done considerably better by avoiding longer-term bonds during this period, but even for us, it's been tough sledding in bond land.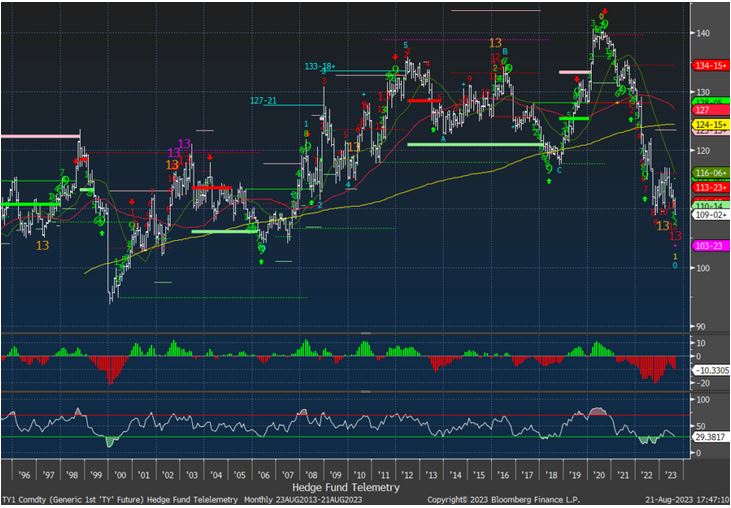 What have you done for me lately?
Let's zoom in even closer so we can really see what's happened in bonds so far in 2023 and why the recent reversal higher in yields is so significant. The chart below continues to focus on the benchmark 10-year Treasury yield. Note the August 2020 low (0.52%) and the huge run higher to last fall's peak (4.14%). From there, things get really interesting.
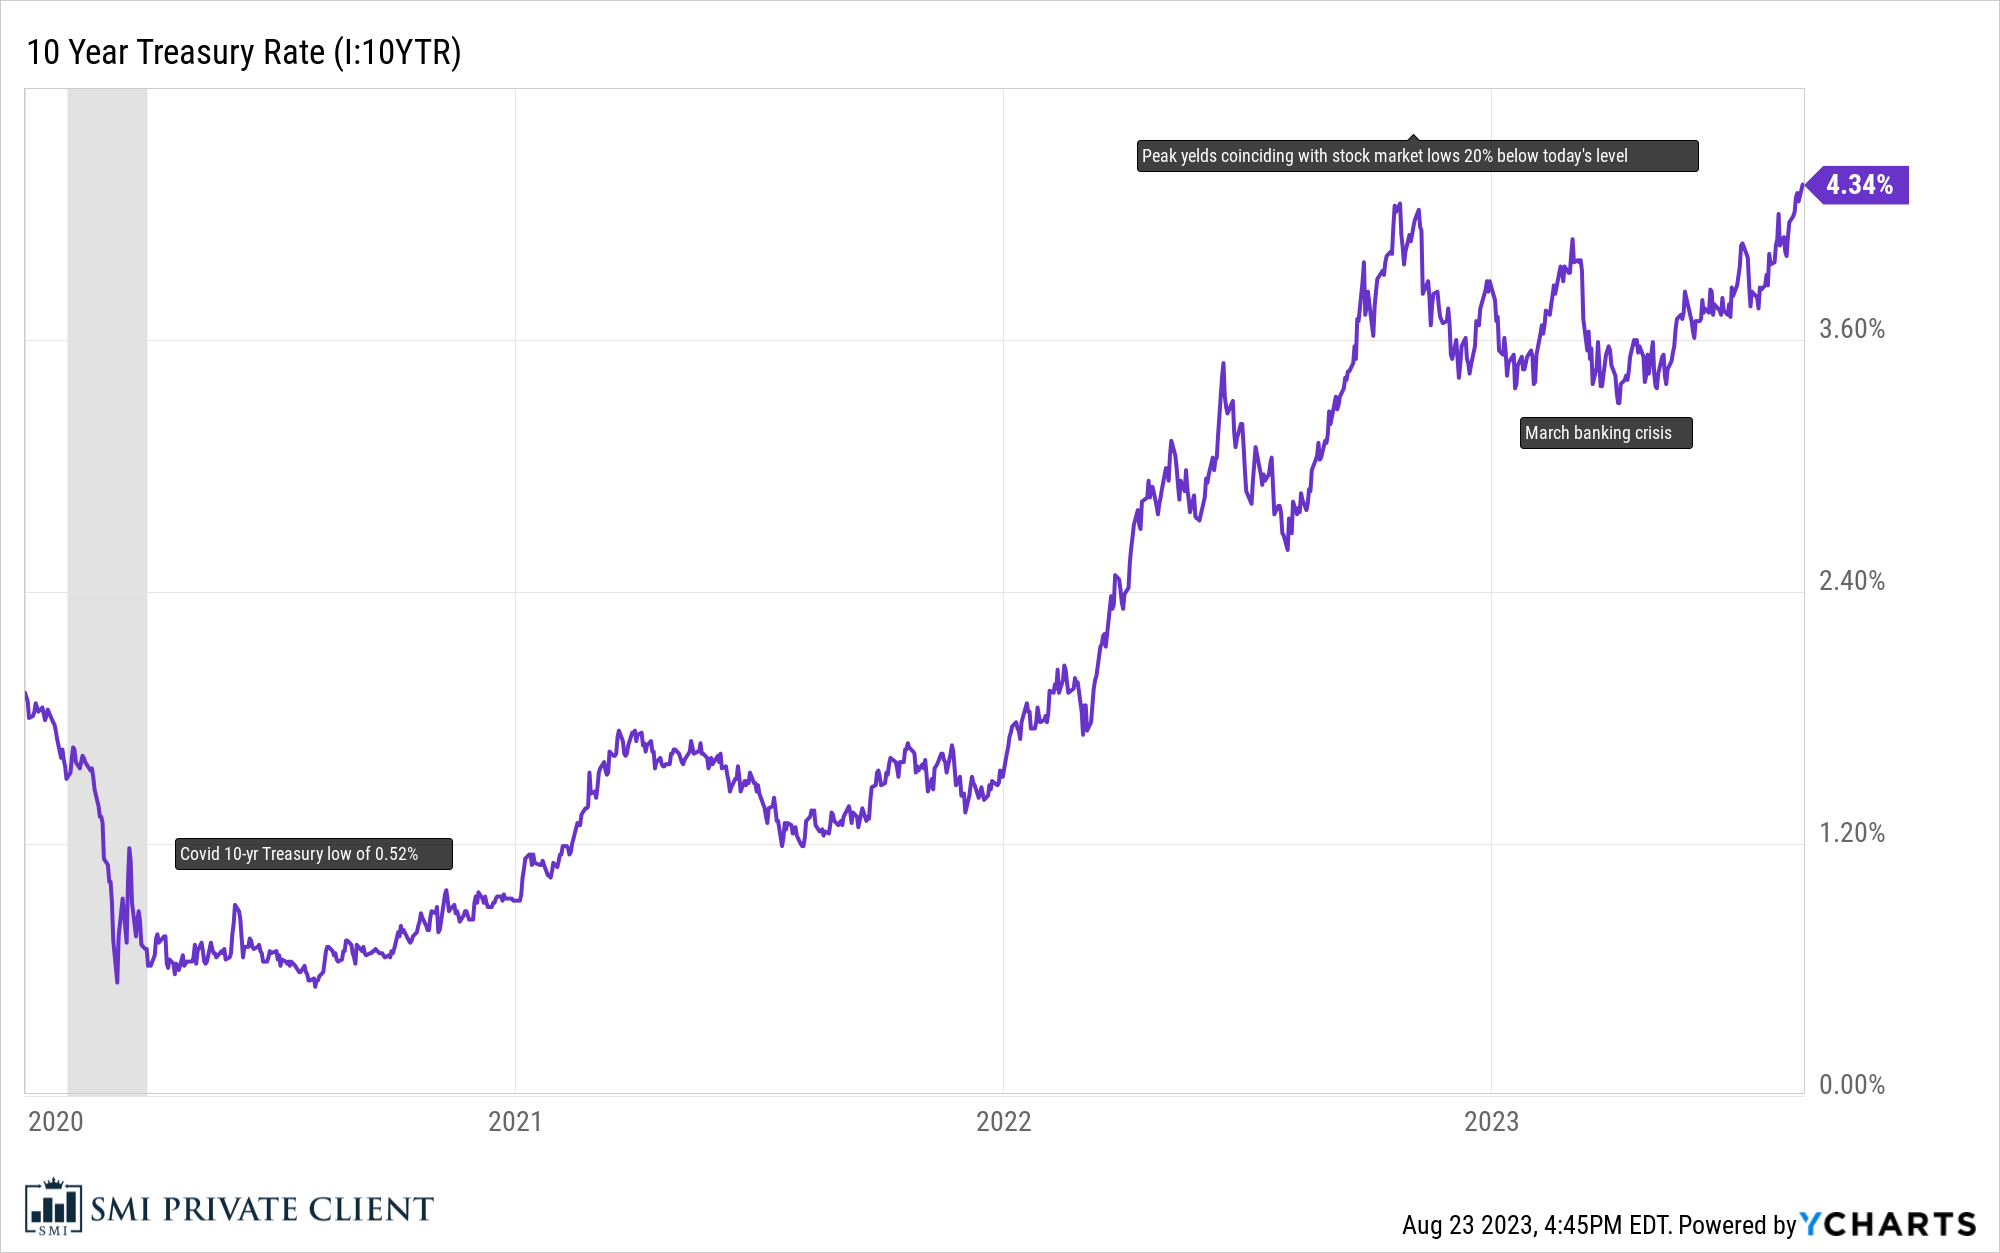
(Sorry about the tiny text in the chart labels! I'll make them bigger next time. They simply point out the August 2020 COVID low of 0.52% for the 10-year Treasury yield, the peak in rates last fall that coincided with the stock market lows some -20% below today's S&P 500 level, and the March 2023 banking crisis.)
You may recall that at the end of last year (2022), it was widely believed a recession was imminent. Bond yields reflected that recessionary view, falling rapidly from 4.14% in November to 3.46% by Jan. 24. But as January unfolded, it became clear a recession wasn't occurring — in fact, economic data was coming in surprisingly strong. Bond yields reacted immediately, spiking back toward 4.00% over the next six weeks. When the March banking crisis brought back vivid memories of 2008, yields dropped hard on renewed recession watch, putting in a new 2023 low of 3.35% in early April.
Since then, the recession-that-never-arrives has convinced a growing number of investors that it isn't ever coming. So despite CPI inflation hitting a new low of 3.0% in June, rates have climbed steadily higher since April, with the rate of change accelerating over the past month. That's been the primary driver behind August's stock market pullback.
TakeawaysReviewing all this, it's clear that investors' collective belief regarding a future recession is playing a huge role in the direction yields move, which in turn influences (eventually) the direction of the stock market (as well as virtually every other market). When recession fears pick up, yields fall. When confidence grows that a recession will be avoided, yields rise.
There are plenty of threads to pull from here, but we're going to leave this here for today.
One final thought before we do, though. If your initial reaction to reading this is to think you should reduce your exposure to bonds, here's something to ponder. If the stock market had just erased most of its gains from the past 15 years following a bruising multi-year bear market, at that point would you want to become a seller? Or would you think that was potentially a great time to put capital to work after such a huge move lower?On one hand, the recent move in bonds have made the asset class potentially more attractive than it has been in years. (Said differently, three years ago investors were lending the government money for 10 years and earning 0.52% interest for the privilege; today they're getting paid 4.34% for making an identical loan. It's not a trick...today's deal is dramatically better.)
On the other hand, bond market cycles tend to be long-lasting. So the recent breakout of the 40-year channel does carry a potential warning regarding yields continuing higher.
*Images used with permission. *Related Articles

May 25, 2025
How To Choose The Right Financial Advisor
For Christians who want their finances to reflect their faith, it’s about more than just numbers and returns....

April 13, 2025
Time for Foreign Stocks to Shine?
Have stocks shifted in a different Direction? Recent pickup in foreign returns has certainly grabbed our attention....

March 18, 2025